
For fleet managers overseeing operations across London, Paris, Brussels or other European hubs, recurring overbookings, unbilled fees representing 8-12% of revenue, and two-day monthly reporting cycles consume valuable time that could be invested in business development. The gap between current performance—often around 68% fleet utilisation—and the 80%+ benchmark achieved by optimised operations represents significant untapped profitability.
Successfully managing car rental operations across Europe requires a holistic approach structured around five interdependent operational pillars: dynamic planning, fleet tracking, customer and booking management, financial control, and analytics. Supported by integrated technology infrastructure adapted to multi-jurisdictional European realities, this structured methodology enables the transition from fragmented manual management to scalable, profitable operations.
- The operational complexity of European car rental markets
- What are the core pillars of effective fleet management?
- Streamlining booking and reservation workflows
- How do you maintain fleet health and compliance across borders?
- Leveraging data analytics to drive profitability
- Which technology infrastructure supports scalable operations?
- Common questions about car rental operations management
The operational complexity of European car rental markets
Unlike unified regulatory markets such as the United States or the domestic UK market, European car rental operations must navigate a fragmented landscape where each member state maintains distinct requirements governing insurance, taxation, consumer protection, and cross-border movement. This regulatory diversity transforms straightforward operations into complex multi-jurisdictional coordination challenges.
The European Commission’s case study on car rental found that European leasing and short-term rental associations represented approximately 1,500 leasing firms and over 520 short-term rental companies in 2020. Within this diverse sector, regulatory compliance remains a persistent challenge. Consumer protection authorities from ten EU member states and Norway examined 78 car rental intermediary websites in 2022 and discovered that only 45% complied with EU consumer protection law, according to the European Consumer Centres Network.
Regulatory divergence in practice: Motor insurance requirements illustrate the complexity operators face. While Directive 2009/103/EC establishes EU-wide minimum compulsory cover at EUR 1,000,000 per victim for personal injury and EUR 1,000,000 per claim for property damage, individual Member States prescribe higher guarantees. Operators must verify and maintain compliance with each country’s specific requirements, not merely the EU minimum.
Beyond insurance, e-invoicing mandates vary significantly by jurisdiction. France introduced mandatory e-invoicing requirements with a phased implementation timeline beginning in 2024, whilst the United Kingdom maintains no comparable mandate. Germany requires specific electronic formats for B2B transactions. For an operator managing vehicles across these three markets, this translates to three distinct invoicing workflows, each with different technical specifications and legal obligations.
Multi-currency handling, multi-language customer service, variable VAT treatment, and cross-border fine reassignment add further operational layers. When a vehicle rented in London is driven through France and returned in Brussels, the operator must coordinate insurance coverage across three jurisdictions, manage toll violations from French authorities, apply correct VAT treatment for the cross-border transaction, and ensure compliance with three sets of consumer protection regulations.
The post-2020 period accelerated digital transformation across the sector. Contactless rental processes, yield management adoption, and integrated management systems shifted from competitive advantages to operational necessities. Manual coordination methods—Excel spreadsheets, telephone calls between sites, email-based booking confirmations—increasingly fail to deliver the real-time visibility and automation required for profitable multi-site operations in compressed-margin environments.
What are the core pillars of effective fleet management?
Transforming fragmented operations into a scalable, profitable business requires addressing five fundamental operational pillars simultaneously. Each pillar represents a critical operational domain; collectively, they form an interdependent system where improvements in one area amplify benefits across others.
The five operational pillars:
- Dynamic Planning & Availability: Real-time synchronisation across all booking channels eliminates overbookings and maximises vehicle utilisation through accurate availability visibility.
- Fleet Health & Compliance Tracking: Preventive maintenance scheduling, mileage monitoring, and multi-jurisdictional compliance monitoring optimise vehicle longevity whilst ensuring regulatory adherence.
- Customer & Booking Workflows: Streamlined check-in/check-out processes, automated communications, and integrated documentation reduce transaction time whilst improving customer satisfaction.
- Financial Control & Billing: Automated invoicing, cross-border fee reassignment, and extras billing recovery transform revenue leakage into captured profitability.
- Analytics & Profitability Insights: Real-time dashboards tracking utilisation rates, RevPAR, and cost per kilometre enable data-driven decisions replacing intuition-based management.
The interdependence between pillars defines their collective power. Dynamic planning (pillar 1) depends on accurate fleet health data (pillar 2) to avoid booking vehicles scheduled for maintenance. Customer workflows (pillar 3) generate the transaction data feeding financial control systems (pillar 4). Analytics (pillar 5) identify under-performing vehicles, informing planning decisions (pillar 1) and maintenance priorities (pillar 2).
Operators addressing only isolated symptoms—implementing yield management without improving availability synchronisation, or automating invoicing without streamlining workflows—achieve limited results. A vehicle booked at an optimised dynamic price delivers no revenue if an overbooking forces the operator to decline the reservation. Automated invoicing captures no additional fees if check-out processes fail to document fuel consumption or damage accurately.
The evolution from artisanal to industrialised operations follows a recognisable pattern. Initially, each pillar operates through disconnected tools and manual processes: Excel spreadsheets track availability, separate accounting software manages invoicing, email handles customer communications, phone calls coordinate maintenance, and monthly reporting requires two days of manual consolidation. This fragmented approach functions adequately for small single-site operations but collapses under the coordination demands of multi-site European operations.
Structured improvement prioritises building integrated capabilities where operational data flows automatically between pillars. A maintenance alert (pillar 2) automatically updates availability (pillar 1), triggers customer rebooking workflows (pillar 3), adjusts financial forecasts (pillar 4), and feeds analytics dashboards (pillar 5) without manual intervention. This systematic integration delivers the 20% utilisation improvements, 33% fee recovery increases, and 50% check-in time reductions that transform mid-sized operations from survival mode to strategic growth.
Streamlining booking and reservation workflows
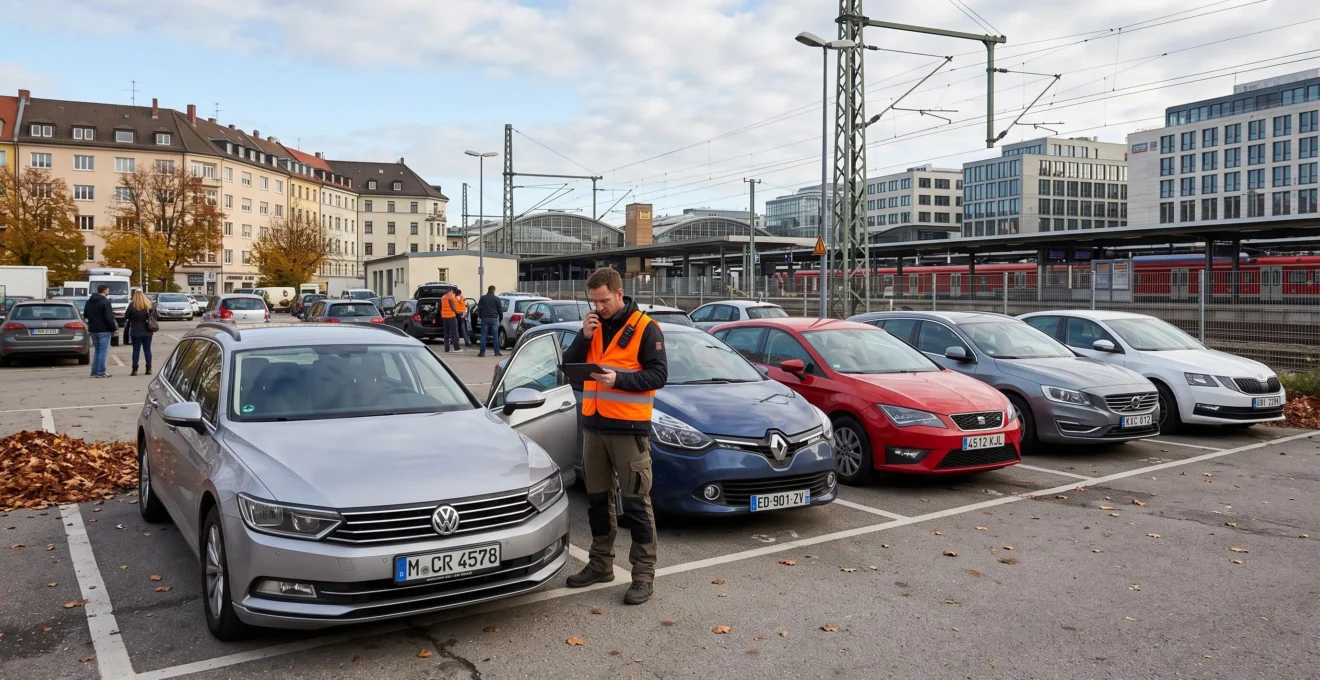
Recurring overbookings represent one of the most visible symptoms of inadequate booking management. When a walk-in customer books the last available vehicle at the London location whilst an online reservation simultaneously confirms the same vehicle, the operational consequences extend beyond immediate customer dissatisfaction. The operator must secure a replacement vehicle—often at premium cost—or decline the booking entirely, forfeiting revenue and damaging reputation.
Real-time availability synchronisation across all channels provides the foundation for reliable operations. A single source of truth tracks actual vehicle availability accounting for confirmed bookings, vehicles in maintenance, damage repairs, and cross-border movements. When the London counter staff books a vehicle, the website inventory updates instantly, preventing simultaneous online reservations. When the Paris location marks a vehicle for scheduled servicing, that unit becomes unavailable across all booking channels automatically.
Modern rental car management software centralises this coordination through integrated booking engines connecting website reservations, telephone bookings, walk-in customers, and third-party platform integrations. The technical architecture matters less to operators than the operational outcome: visibility into actual availability across all sites and channels, updated in real-time without manual coordination calls or email confirmations.
- Centralise availability dataEstablish a single authoritative system recording all vehicle bookings, maintenance schedules, and status changes. Eliminate parallel spreadsheets and location-specific booking logs that create synchronisation gaps.
- Integrate all booking channelsConnect website booking engines, counter reservation systems, telephone booking processes, and third-party platforms to the centralised availability system via API integrations or direct database connections.
- Establish automated conflict detectionConfigure automatic alerts when approaching capacity limits, flag potential scheduling conflicts before they become overbookings, and implement allocation priority rules for simultaneous booking attempts.
Dynamic yield management transforms availability visibility into revenue optimisation. Rather than applying static rate cards regardless of demand conditions, yield management adjusts pricing based on booking lead time, vehicle category availability, seasonal patterns, and demand forecasts. A premium SUV books at €50 per day mid-week when demand is low, but the same vehicle commands €75 per day for weekend bookings when leisure demand spikes. This dynamic approach maximises revenue per available rental (RevPAR) without requiring additional vehicles or locations.
15-25%
revenue increase
Achievable RevPAR improvement through dynamic pricing implementation versus static rate cards, enabling operators to capture demand-driven revenue opportunities without fleet expansion.
Automated booking confirmations and customer communications reduce the manual workload consuming staff time whilst improving customer experience. When a customer completes an online reservation, the system automatically generates confirmation emails with details of the rental agreement, sends reminder notifications 48 hours before pickup, and triggers follow-up communications for contract extensions or early returns. This automation eliminates the manual email composition and telephone confirmation calls that previously consumed 15-20 minutes per booking.
Check-in and check-out workflow optimisation directly addresses the 15-20 minute per vehicle processing time that frustrates customers and constrains capacity during peak periods. Digital documentation capture through tablets or mobile devices, pre-filled rental agreements pulled from booking data, contactless key handover protocols, and photographic damage documentation reduce counter time by half whilst maintaining thorough record-keeping. The cumulative effect across a 65-vehicle fleet processing 40 rentals weekly represents approximately 10 hours of reclaimed staff time—time redirected toward customer service, vehicle preparation, or business development activities.
How do you maintain fleet health and compliance across borders?

Preventive maintenance distinguishes professionally managed fleets from reactive operations where breakdowns dictate servicing schedules. Automated maintenance alerts based on mileage intervals, time periods, and manufacturer specifications ensure vehicles receive timely servicing before minor issues become expensive failures. A vehicle approaching its 15,000-kilometre service interval triggers an automatic alert 500 kilometres in advance, enabling the operator to schedule servicing during low-demand periods rather than pulling the vehicle from inventory during peak weekend demand.
The financial impact extends beyond repair cost differentials. Preventive servicing scheduled Tuesday morning during a low-demand period costs the same as reactive servicing but avoids the opportunity cost of unavailability during high-demand Saturday when the vehicle could generate €90-140 in daily revenue. Across a 65-vehicle fleet, intelligent maintenance scheduling contributes measurably to the utilisation rate improvements that distinguish 68% from 80%+ performance.
Mileage tracking and vehicle rotation optimisation enable data-driven fleet composition decisions. Monitoring individual vehicle utilisation patterns reveals under-performing assets generating minimal revenue relative to depreciation and fixed costs. A compact car achieving only 45% utilisation whilst SUVs consistently reach 90% signals a category imbalance. Rather than retaining under-performing inventory out of habit, operators use utilisation data to guide fleet composition adjustments—retiring low-demand vehicles and reallocating capital toward high-demand categories.
Cross-border fine reassignment represents one of the most operationally complex yet financially significant aspects of European fleet management. Unlike domestic operations where a single authority issues fines and collection follows standardised procedures, cross-border scenarios involve multiple jurisdictions with distinct notification systems, timelines, and liability frameworks.
Fine notification timeline variations: The United Kingdom typically issues penalty notices within 14 days of the alleged offence, France allows up to 45 days, and Germany up to 90 days. Missing jurisdiction-specific deadlines for contesting fines or reassigning liability forfeits the operator’s reassignment rights, converting recoverable customer charges into unrecoverable business costs. Operators must track these varying timelines simultaneously across all operating jurisdictions.
Automated fine management systems capture notifications from multiple national authorities, match violations to specific rental contracts and drivers using registration data and rental dates, generate customer charge invoices with jurisdiction-appropriate documentation, and manage appeals processes when warranted. This automation transforms a process consuming hours of manual administration per fine into a largely automatic workflow requiring intervention only for exceptions.
The financial impact justifies the implementation effort. An operator processing 2,000 rentals annually with a 12% fine incidence rate faces approximately 240 fine reassignments. At an average fine value of €60-90 and historical recovery rates of 60% through manual processes, automated systems achieving 80%+ recovery rates capture an additional €2,750-4,400 annually. For mid-sized operators reporting 8-12% revenue leakage from unbilled fees, systematic fine reassignment represents one of the highest-impact recovery opportunities.
| Process | Manual Approach | Automated Approach |
|---|---|---|
| Maintenance scheduling | Weekly mileage checks, paper tracking, reactive scheduling during any availability | Automatic mileage monitoring, advance alerts, optimised scheduling during low-demand periods |
| Administrative time per vehicle | 20-30 minutes per service cycle | 5 minutes per service cycle (exception handling only) |
| Fine notification capture | Manual post sorting, data entry, contract matching | Electronic notification receipt, automatic contract matching via registration and date algorithms |
| Time per fine processed | 25-40 minutes (including customer invoice generation) | 5-8 minutes (automatic processing, manual review for disputes) |
| Fine recovery rate | 60-70% (delays and missed deadlines reduce recovery) | 80-90% (systematic tracking and timely reassignment) |
Claims and damage management with multi-country insurance compliance requires coordinating with insurers across jurisdictions whilst accurately documenting incidents and tracking repair status. Photographic damage documentation at check-in and check-out establishes clear accountability, whilst integration with insurance providers streamlines claim submission and status tracking. Customer liability assessment follows the applicable national framework governing the rental location and incident jurisdiction—a complexity requiring systematic documentation rather than improvised case-by-case approaches.
Leveraging data analytics to drive profitability
Transitioning from intuition-based to data-driven management requires identifying which metrics genuinely drive profitability versus vanity metrics that create measurement activity without decision value. Five core key performance indicators provide the essential profitability dashboard for car rental operations.
Fleet utilisation rate measures the percentage of available vehicle-days actually generating rental revenue. A fleet of 65 vehicles operating 365 days provides 23,725 theoretical vehicle-days annually. At 68% utilisation, the fleet generates 16,133 rental days, leaving 7,592 vehicle-days idle. Improving to 80% utilisation captures an additional 2,847 rental days—representing approximately €230,000-330,000 in additional annual revenue at average daily rates of €80-115, without acquiring additional vehicles.
Revenue per available rental (RevPAR) calculates average revenue generated per vehicle per day across the entire fleet, accounting for both rented and idle periods. This metric reveals pricing effectiveness and category performance. A compact car category achieving €48 RevPAR whilst SUVs reach €77 RevPAR signals both utilisation and pricing differentials worth investigating. RevPAR analysis by location, season, and booking channel identifies specific optimisation opportunities obscured by aggregate revenue figures.
Cost per kilometre tracks the all-in operational cost including fuel, maintenance, insurance, and depreciation per kilometre driven. This metric enables profitability assessment by vehicle, identification of cost outliers requiring attention, and informed decisions about vehicle lifecycle and category mix. A vehicle showing €0.37 per kilometre whilst category average is €0.27 warrants investigation—potentially revealing excessive maintenance costs signalling retirement or specific operational issues requiring correction.
Fees recovery ratio measures the percentage of ancillary fees, fines, damage charges, and fuel supplements successfully billed and collected versus total potential fees. Operators reporting 8-12% revenue leakage typically achieve 60-75% recovery ratios, leaving 25-40% of legitimate charges unbilled or uncollected. Systematic workflow improvements and automated reassignment can lift recovery ratios to 85-92%, directly converting previously lost revenue into captured profitability.
Customer acquisition cost versus lifetime value distinguishes profitable customer segments from loss-making acquisition channels. A corporate contract customer generating 15 rental days annually at an acquisition cost of €140 delivers substantially better economics than one-time leisure customers acquired through high-commission online travel agencies. This insight guides marketing investment allocation and partnership prioritisation.
2 days → 5 minutes
Monthly financial reporting transformation: from two days of manual Excel consolidation across multiple sites to five minutes generating automated dashboards from integrated operational data.
Profitability reporting segmented by vehicle, site, and period transforms aggregate performance data into actionable insights. Discovering that the Brussels location achieves only 58% utilisation whilst London reaches 76% and Paris 81% prompts specific diagnostic questions: Does Brussels face demand challenges requiring marketing investment? Are pricing or vehicle category mix misaligned with local market conditions? Do operational inefficiencies depress performance? Aggregate fleet-level reporting masks these location-specific issues, whilst segmented analysis surfaces them for targeted intervention.
Predictive analytics for demand forecasting represents an evolution beyond reactive performance measurement toward proactive management. Historical booking patterns, lead time analysis, local event calendars, and seasonal trends enable demand anticipation. Identifying that a major conference in Paris during March typically generates 35% above-baseline SUV demand allows proactive rate increases and vehicle allocation from lower-demand locations. This anticipatory approach captures revenue opportunities that reactive operators miss through static pricing and fixed allocation patterns.
| KPI | Industry Benchmark Range | What Low Values Indicate | Primary Improvement Lever |
|---|---|---|---|
| Fleet utilisation rate | 70-85% (varies by market and seasonality) | Excess capacity, weak demand generation, or poor availability management | Dynamic pricing, marketing investment, overbooking prevention |
| Revenue per available rental (RevPAR) | €50-85 per vehicle per day (varies by category and location) | Pricing below market potential or low utilisation dragging average | Yield management implementation, category mix optimisation |
| Cost per kilometre | €0.20-0.32 (varies significantly by vehicle category and age) | Excessive maintenance costs, inefficient fuel management, or aged fleet | Preventive maintenance, vehicle lifecycle management, fuel policies |
| Fees recovery ratio | 85-95% for well-managed operations | Weak documentation, delayed billing, or inadequate collection processes | Automated fine reassignment, systematic damage documentation, workflow improvement |
| Customer acquisition cost vs lifetime value | LTV should exceed CAC by 3:1 minimum for sustainable economics | Unprofitable acquisition channels or poor customer retention | Channel mix reallocation, corporate contract development, loyalty programmes |
The transformation from two-day monthly reporting cycles to real-time dashboards accessible in minutes liberates operational management time for strategic activities. Rather than spending the first two working days of each month consolidating spreadsheets, managers access current performance data continuously, enabling in-month course corrections instead of retrospective analysis of historical problems. This shift from accounting archaeology to operational navigation represents one of the most tangible quality-of-life improvements accompanying systematic operations optimisation.
Which technology infrastructure supports scalable operations?

Software-as-a-Service (SaaS) deployment models address the specific constraints mid-sized car rental operators face when evaluating technology investments. Unlike traditional on-premise software requiring substantial upfront capital expenditure, dedicated IT infrastructure, and internal technical expertise, SaaS solutions operate on subscription pricing models with costs scaled to fleet size and feature requirements.
For a 65-vehicle operation, SaaS architecture delivers several operational advantages beyond cost structure. Accessibility from any device and location enables the operations director to monitor London performance from Paris, review booking activity from a mobile device, and access financial dashboards without being physically present at a specific office workstation. This multi-device accessibility supports the multi-site coordination requirements inherent to European operations spanning multiple cities and countries.
Rapid deployment timelines—typically measured in weeks rather than months—reduce the implementation disruption that concerns operators worried about business continuity during technology transitions. A phased deployment approach brings one location online initially, validates functionality with real operations, refines configurations based on actual usage, and then extends to additional sites. This staged methodology mitigates the risk of simultaneous multi-site disruption whilst enabling learning and adjustment during rollout.
Automatic software updates without internal IT burden ensure regulatory compliance features remain current as European requirements evolve. When France modifies e-invoicing specifications or GDPR enforcement guidance clarifies data retention obligations, SaaS providers incorporate these changes into the platform and deploy updates automatically. Operators benefit from regulatory currency without dedicating internal resources to monitoring legislative changes and implementing technical modifications.
SaaS advantages for mid-sized operators:
- Lower upfront investment—subscription pricing eliminates capital expenditure barriers that constrain mid-sized operator technology adoption
- No IT staff requirement—cloud hosting and vendor-managed infrastructure remove the need for dedicated technical personnel
- Rapid deployment—weeks to operational launch versus months for on-premise implementations
- Automatic compliance updates—regulatory changes incorporated by vendor without operator intervention or cost
- Scalable capacity—seamlessly accommodate fleet growth from 65 to 100+ vehicles through configuration rather than architectural changes
SaaS considerations:
- Ongoing subscription costs—whilst lower than upfront capital expenditure, subscriptions represent permanent operational expenses
- Internet dependency—cloud-based architecture requires reliable connectivity, though offline modes address temporary outages
- Data residency—operators must verify vendor data hosting locations comply with applicable data protection requirements
Critical integrations eliminate the manual data re-entry consuming administrative time across disconnected systems. Accounting system integration automatically creates invoices and payment records in financial software when rental transactions complete, removing the manual entry work currently requiring 8-10 hours weekly for a 65-vehicle operation processing 40 rentals per week. Website booking engine integration provides the real-time availability synchronisation preventing overbookings. Payment gateway integration secures online transactions and automates collection. Email and SMS integrations deliver automated customer communications without manual composition.
- Accounting system integrationConnect rental management platform to accounting software (Xero, QuickBooks, Sage) to eliminate manual invoice and payment entry—typically the largest administrative time sink consuming 8-12 hours weekly.
- Website booking engine integrationImplement real-time availability synchronisation between website and core booking system to prevent overbookings and enable 24/7 online reservations without manual confirmation.
- Payment gateway integrationIntegrate secure payment processing (Stripe, WorldPay) to automate transaction handling, reduce payment collection delays, and eliminate manual payment recording.
- Communication platform integrationConnect email and SMS systems to automate booking confirmations, pickup reminders, and follow-up communications—removing 15-20 minutes of manual work per reservation.
Open APIs and scalability architecture ensure technology infrastructure supports rather than constrains business growth. An operator planning to expand from 65 to 100 vehicles over 18 months and add two additional locations requires systems that accommodate this growth through configuration rather than architectural replacement. Scalable platforms handle increased transaction volumes, additional users, and expanded locations without performance degradation or fundamental re-implementation.
Implementation considerations for non-tech-savvy teams directly address adoption concerns that plague technology investments. Counter staff typically achieve operational proficiency in core booking and check-out functions within 2-3 days of structured training plus 1-2 weeks of supervised usage. Management reporting and analytics features require additional training—typically 1-2 days for operations managers. Vendors providing role-specific training materials, workflow-based instruction rather than feature-list documentation, and ongoing support during initial usage periods facilitate smoother adoption than generic software training approaches.
The realistic return on investment for mid-sized fleets justifies the subscription costs that initially concern budget-conscious operators. A 65-vehicle operation investing €14,000-21,000 annually in comprehensive rental management software typically captures €17,000-25,000 through improved fee recovery (addressing the 8-12% revenue leakage problem), saves €11,500-16,000 in administrative time (liberating 25-30% of coordination time), and generates €14,000-21,000 in additional revenue through utilisation improvements (moving from 68% toward 80%). Total annual benefits of €42,000-62,000 against costs of €14,000-21,000 deliver payback periods under six months and ongoing positive returns thereafter.
Common questions about car rental operations management
What return on investment can mid-sized operators realistically expect from car rental management software?
Mid-sized operators managing 50-100 vehicles typically achieve payback periods of 4-8 months through combined benefits: fee recovery improvements capturing previously lost revenue (€17,000-29,000 annually addressing 8-12% leakage), administrative time savings worth €11,500-17,000 annually (25-30% efficiency gains), and utilisation rate improvements generating €14,000-23,000 in additional revenue (moving from 68% toward 80%+ utilisation). Total annual benefits typically range from €42,000-69,000 against subscription costs of €14,000-23,000, though actual results depend heavily on current baseline inefficiency levels and implementation quality.
How long does implementation typically take and will it disrupt ongoing operations?
Phased SaaS implementations for mid-sized fleets typically require 4-8 weeks from contract signature to full operational launch. A staged approach deploys one location initially (2-3 weeks including data migration, configuration, and staff training), validates functionality with real operations (1-2 weeks), then extends to remaining sites (1-2 weeks per additional location). This methodology maintains business continuity by keeping existing systems operational during transition and enables learning from initial deployment before full rollout. Critical success factors include dedicated internal project ownership, realistic timeline expectations, and vendor support during the first month of live usage.
How do I ensure GDPR compliance when managing customer data across multiple European countries?
GDPR compliance for car rental operations requires systematic attention to data collection consent, retention period limitations, cross-border transfer safeguards, and customer rights fulfilment. Verify that rental management systems provide explicit consent capture at booking, automated data retention policy enforcement (typically 6-7 years for financial records, shorter periods for marketing data), data hosting within the European Economic Area or under adequate safeguards, and customer access request workflows enabling GDPR-mandated responses within 30 days. Additionally, ensure rental insurance policies and data processing agreements with third-party providers (payment processors, telematics vendors) include appropriate data protection clauses. Regular staff training on data minimisation principles and breach notification procedures completes the compliance framework.
What training is required for teams without strong technical backgrounds?
Counter staff typically achieve operational proficiency in core booking, check-in, and check-out functions within 2-3 days of role-specific training followed by 1-2 weeks of supervised usage with experienced support available. Training structured around actual workflows (processing a walk-in booking, conducting vehicle handover, handling a return) proves more effective than feature-list approaches. Operations managers require additional training on reporting, analytics, and configuration features—typically 1-2 days beyond basic operational training. Keys to successful adoption include workflow-based training materials reflecting actual job tasks, hands-on practice with realistic scenarios rather than abstract demonstrations, readily accessible quick-reference guides for common tasks, and responsive vendor support during the critical first 4-6 weeks of live usage when questions arise most frequently.
How do integrated systems handle the different VAT rates and invoicing requirements across European countries?
Modern rental management platforms designed for European operations incorporate country-specific VAT rate tables, automatically apply the correct rate based on rental location and transaction type, and generate invoices complying with national formatting requirements. For cross-border rentals, the system applies the applicable VAT treatment rules (typically based on pickup location for short-term rentals) and maintains the documentation required for VAT reporting in each operating jurisdiction. E-invoicing compliance features address country-specific mandates—France’s phased implementation requirements, Germany’s format specifications, and varying adoption timelines across member states. Operators must verify that prospective systems explicitly support all countries where they operate, as generic accounting software often lacks the European rental-specific tax logic required for compliant multi-jurisdictional operations.
Prioritising improvements based on your specific challenges
Not every operator faces identical pain points with equal severity. An operation experiencing frequent overbookings but adequate fee recovery should prioritise booking workflow and availability synchronisation improvements before fine reassignment automation. Conversely, operations with reliable booking processes but significant unbilled fees should address financial control and automated reassignment first.
Diagnostic questions reveal priority areas. If monthly reporting consumes multiple days, analytics infrastructure and integration improvements deliver immediate quality-of-life benefits whilst enabling better operational decisions. If maintenance costs per vehicle significantly exceed category benchmarks, fleet health tracking and preventive scheduling offer substantial cost reduction opportunities. If utilisation rates lag sector benchmarks by 10+ percentage points despite adequate demand, dynamic planning and yield management implementation likely provides the highest return.
The structured five-pillar framework provides the diagnostic lens for identifying which operational domains require immediate attention versus those performing adequately. Most mid-sized European operators discover 2-3 pillars require urgent improvement whilst others need only incremental refinement. Beginning with the highest-impact opportunities—those addressing the largest performance gaps or most painful operational inefficiencies—builds momentum and demonstrates value, facilitating subsequent investments in remaining pillars.
Scaling from 65 to 100+ vehicles whilst simultaneously improving from 68% to 80%+ utilisation and reclaiming 25-30% of administrative time represents an ambitious but achievable transformation. The operators successfully navigating this evolution share common characteristics: systematic assessment of current state performance against benchmarks, honest identification of the 2-3 operational pillars requiring priority attention, committed investment in integrated technology infrastructure rather than continued fragmented point solutions, and realistic expectations about implementation timelines and learning curves.
The European car rental operational landscape will continue evolving—regulatory requirements will tighten, customer expectations will rise, competitive pressure will intensify, and technology capabilities will advance. Operators who establish strong operational foundations structured around the five core pillars position themselves to adapt to these changes from a position of strength rather than perpetual firefighting. The choice between remaining trapped in manual coordination cycles or transitioning to scalable, data-driven operations ultimately determines which mid-sized operators successfully navigate the next phase of European market evolution.